back
discussion
SimHub supports plotting property values over time:
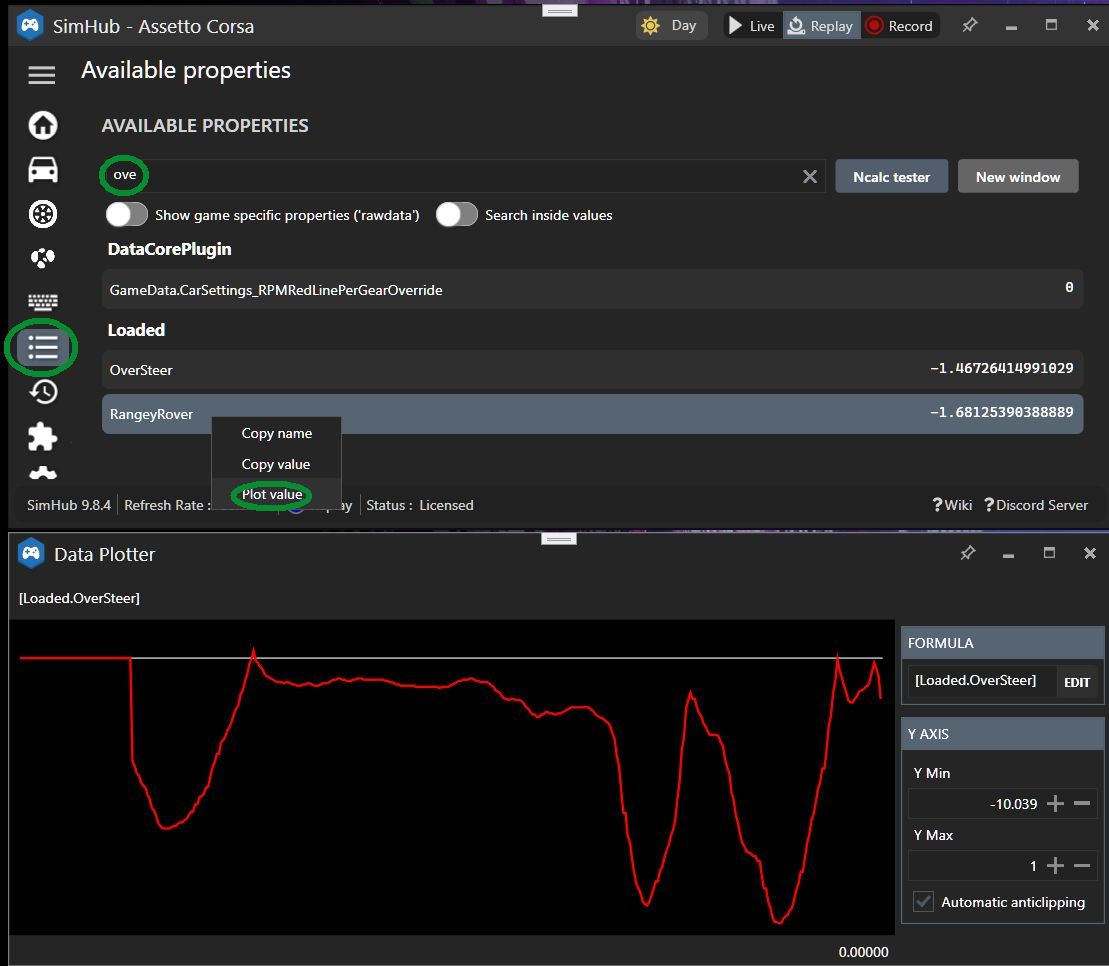
- select Properties in left margin
- enter search term
- right-click property, select
Plot value
OxyScope plugin collects samples for plotting relationships
among up to 4 SimHub properties.
At least for me, evaluating scatter plots while driving is NOT productive.
Instead, using SimHub's  button at the upper right, button at the upper right,
first record some driving, then analyze during Replay...
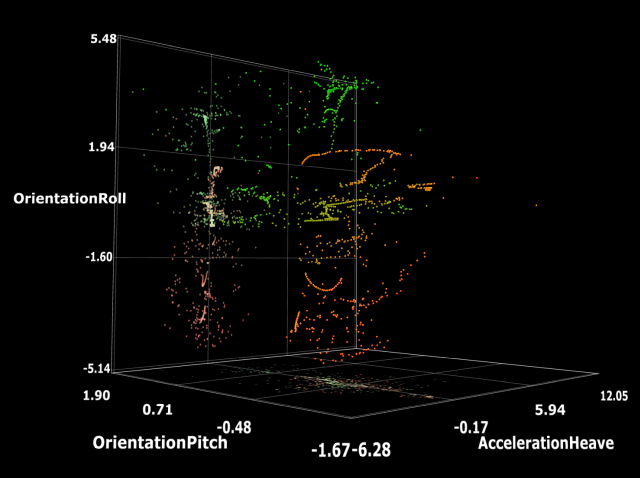
Color-coded samples for up to 3 properties may be plotted vs values of another.
These may subsequently be scatter plotted in 3D.
Intuitively, this works when color-coded property values are correlated.
3D plots of sample values for nominally "dependent" properties
more likely fill ellipsoids than boxes.
Supposing that 2% increments suffice for precision,
that amounts to 51 samples along each "dependent" property axis,
or a sphere with radius 25 and volume of about 65,500 samples.
Sim racing property sample value distributions are unlikely to be uniform.
Indeed, many sample sequences collected at 60Hz are nearly redundant,
tracing trajectories.
OxyScope grow range mode mitigates data clustering by:
- ignoring successive samples with all "dependent" values
differing by less than 2% of properties' current range.
- at suitable intervals, calculate StdDev for each property,
then subsequently ignore samples not well beyond.
- ideally, StdDev thresholding should based on radii...
- Refresh Modes
- OxyScope collects property value sample sets,
discarding duplicates and those at very slow speed.
- one shot - plots will be replaced by new sample collections
- more range - replaceable only by shots
with greater range of selected property
- grow range - supplement and enlarge an initial shot,
initially with samples having larger variances
of selected property, as the sample buffer fills.
This works better with more tightly clustered initial collections.
Buffer filling delays increase
as samples with greater variances become rarer.
Accrual eventually backfills histogram gaps to fill the buffer.
User Interface: top to bottom
- top row: Controls left-to-right
-
Help - link to this page
Current property sample set statistics,
updated at one shot rate;
may not get plotted, depending on buttons to the right...
Refresh button: one shot / grow range / Hold max range
Property selection button
- For one shot refreshes or Hold, selects Y property
to least-square fit line and
monotonic cubic curve.
- for more and grow refresh modes with Auto Replot,
select the property affecting sample set collection.
Hold Plot / Auto Replot button:
- Auto: update plots as new data are available
- Hold: displayed plot remains
until switching to Auto or selecting
REPLOT
REPLOT
button: for Hold, refresh one shot or more range
- row 2: Properties XY plot: OxyPlots of X, Y property sample sets
row 3: two optional Y property names
-
- row 4: Y, X plot required property names
- Copy property names of interest
from SimHub's Available properties window
rows 5, 6: Current plotted property notes and statistics
- typically reports coefficients for fitted lines, cubic fits
bottom row: filters (1 == no filtering)
- Some properties affect others, but with delay.
Increasing filter value for property affecting another
may improve correlation visibility..
OxyScope example application: SimHub slip
|